Getting started with Prism
You can quickly create and modify graphs using Prism’s interactive interface. you need not to install Prism to use it. You simply need to Login into “http://sandbox.relevancelab.com/SPECTRA/login?app=ROLE_PRISM” in a browser.

Once you will login to Prism you will be at Data Analyser’s screen from where you can Select source for Analytics
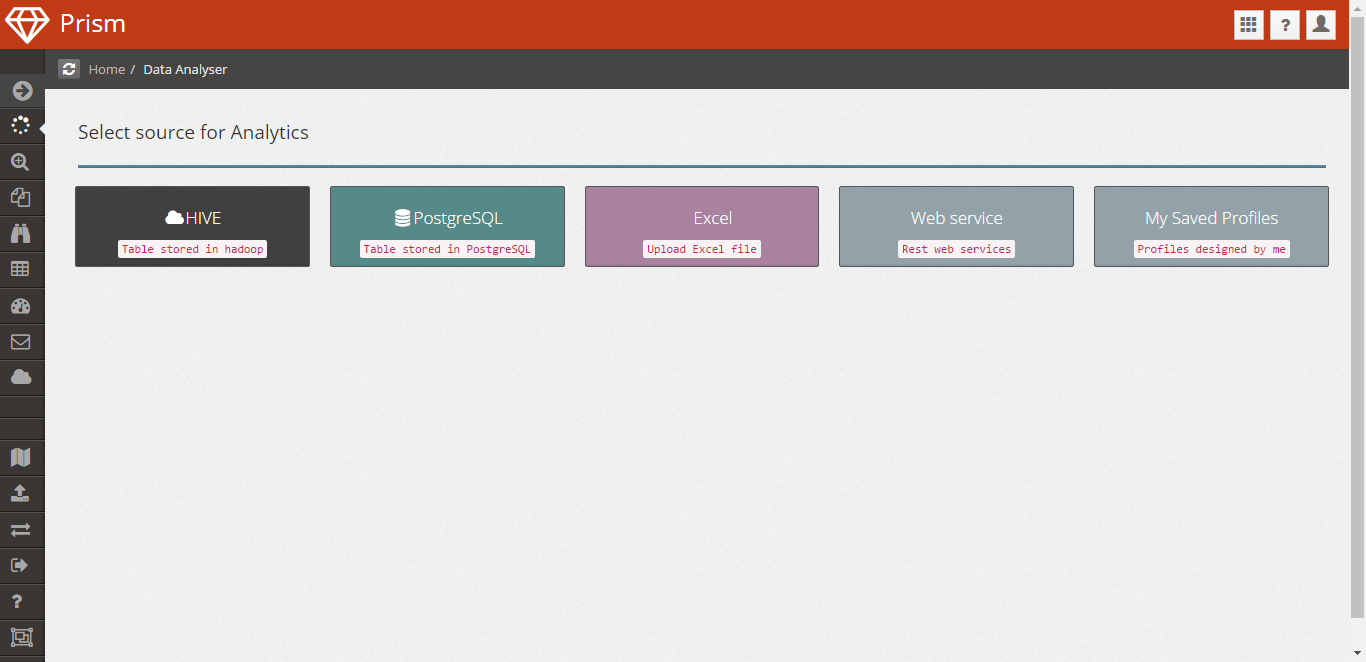
You will be having 5 sources for data analytics:
- HIVE: table stored in hadoop
- PostgreSQL: table stored in postgreSQL
- Excel: you can upload excel file
- Web service: rest web services
- My Saved Profiles: profiles designed by you
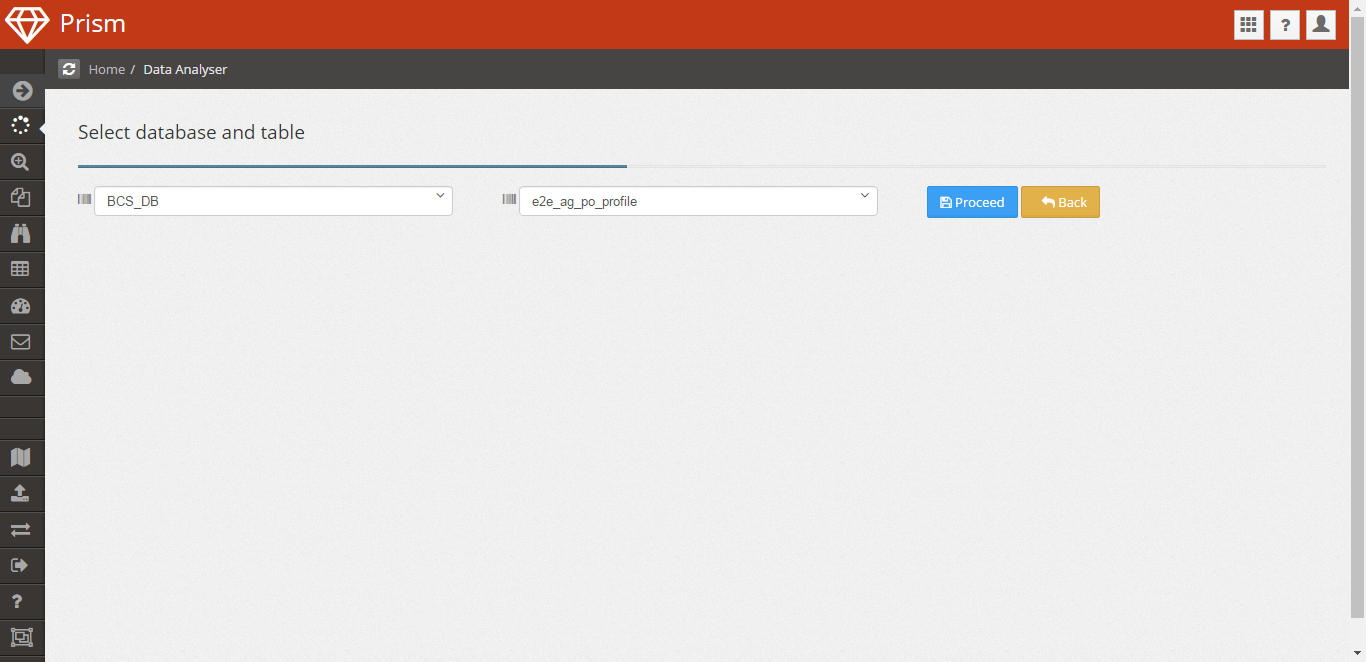
Select any one of the above, for instance click on HIVE, you will be navigate to- select database and table page:

select database and table from the dropdown and click on proceed button:
By clicking on proceed button you will be on the screen from where you can start drawing your charts
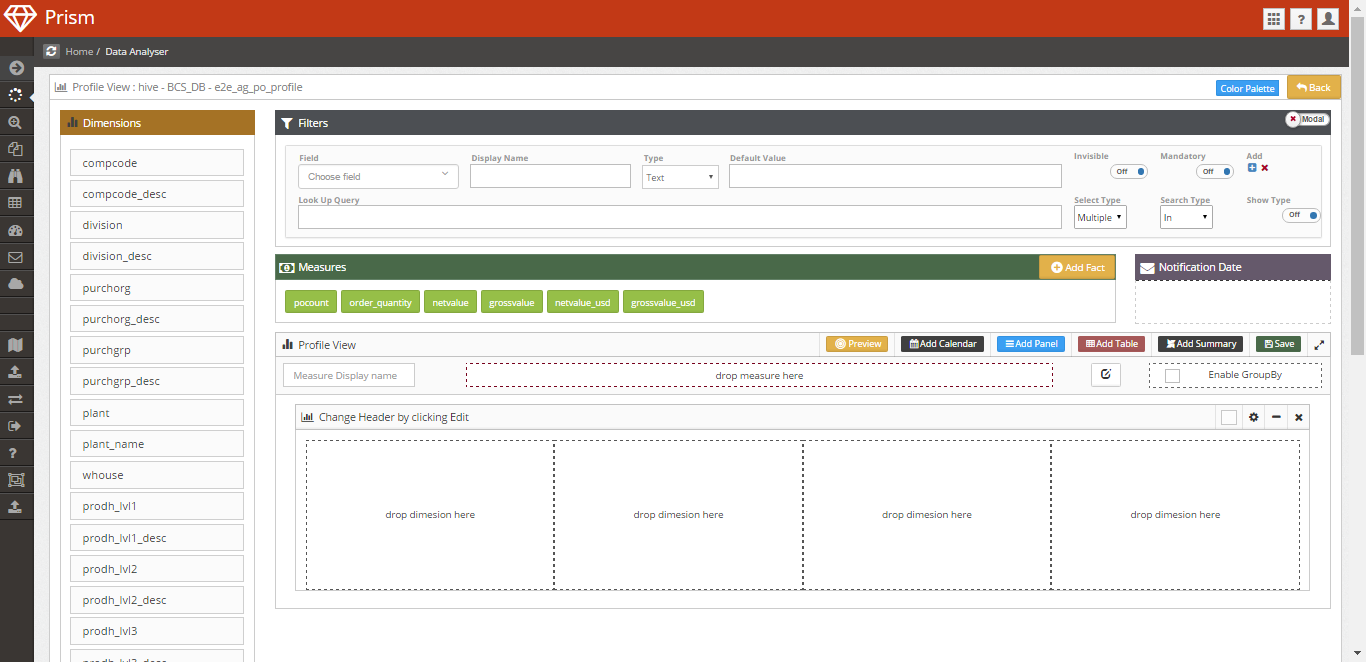
Here, you have different sections from where you can specify and can draw the graph. We have 5 sections in the page which are:
- Dimensions
- Filters
- Measures
- Notification Date
- Profile View
You can drag any dimension and measure from the Dimensions and Measures section in Profile View section to draw the graph
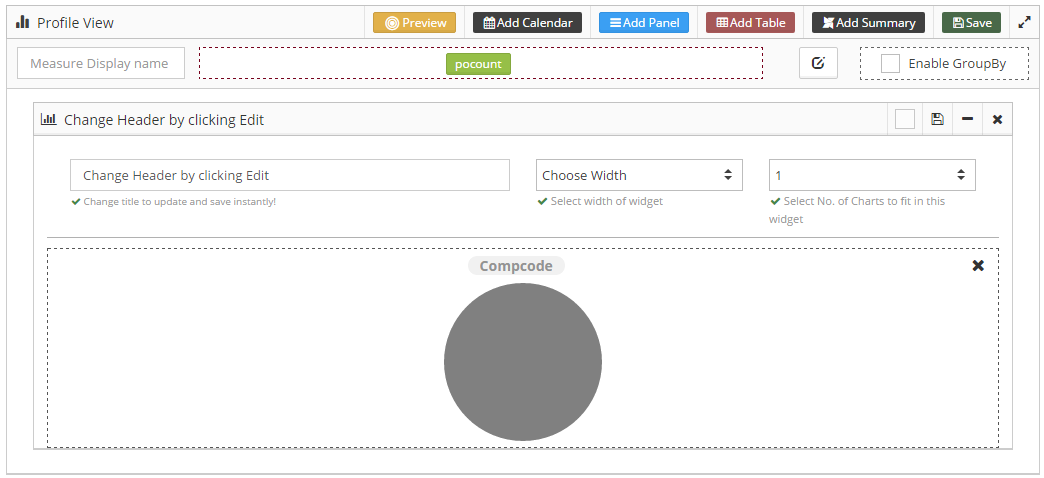
Click on the graph lable, you can specify the type of the chart and can edit the properties of the graph. Bydefault type of the chart would be Pie

Select chart type to Bar and click on Save button. and click on Preview Button
