Summary
A brief statement or account of the main points. We can add summary to the table:
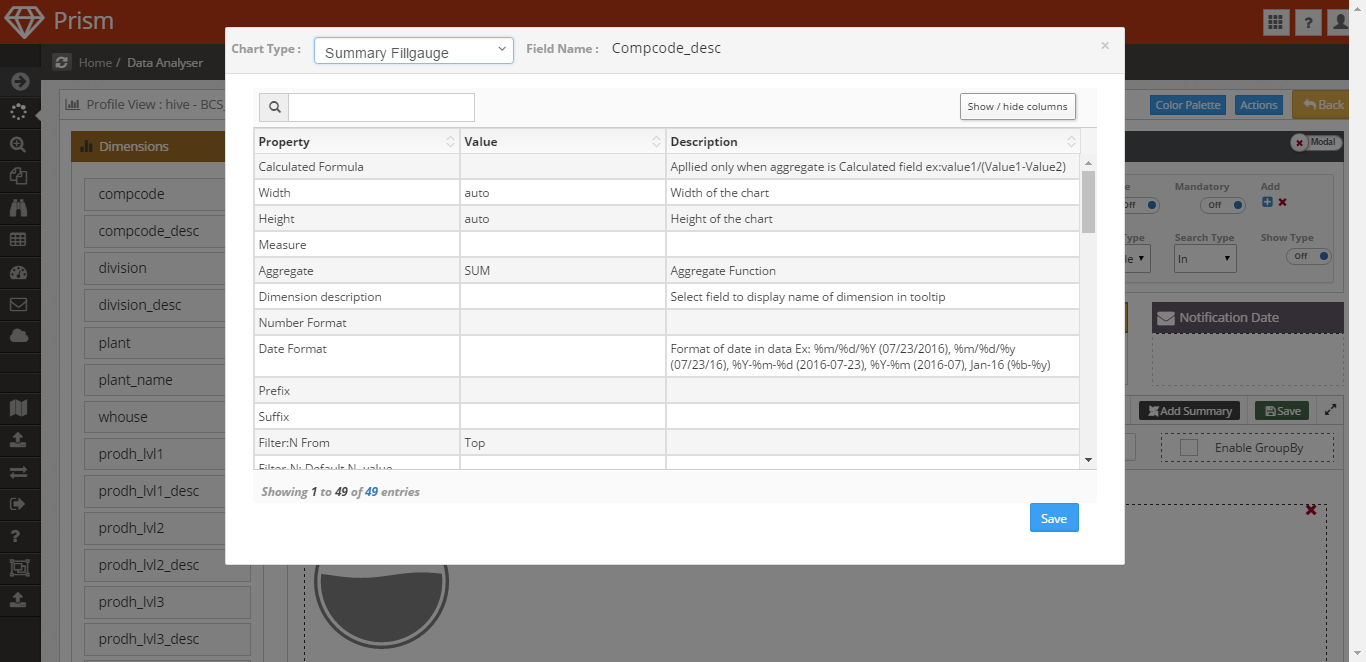
- Click on Add Summary button, one table will open
- Select the Chart Type from the drop down, we have options: Summary Fillgauge, Summary Ibox, Summary Message, Summary Circle
- Set properties as required
- then, click on Save button
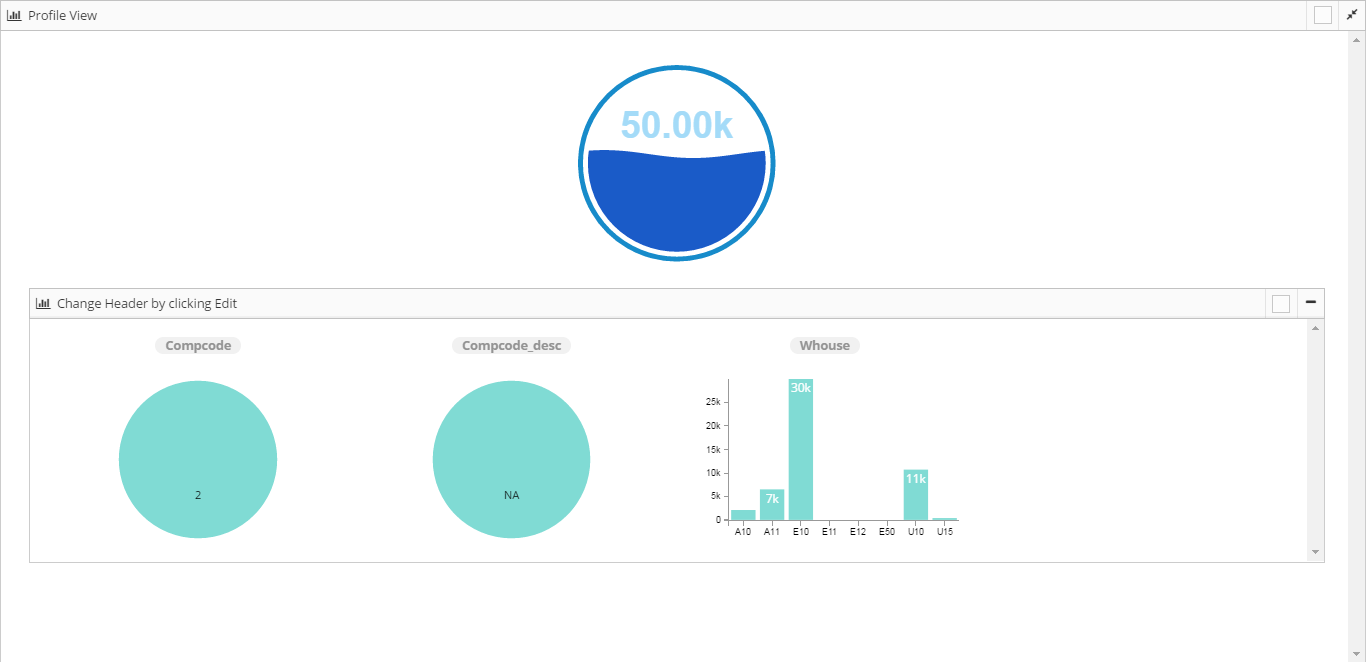
- Click on Preview button to see the preview
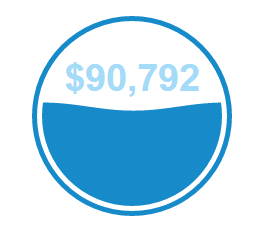
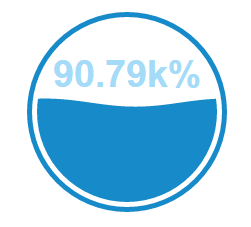
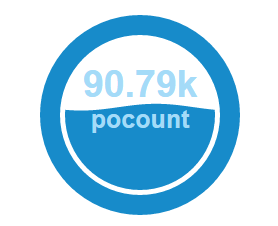
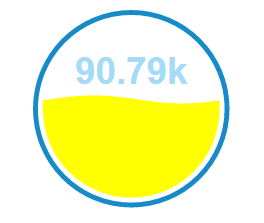
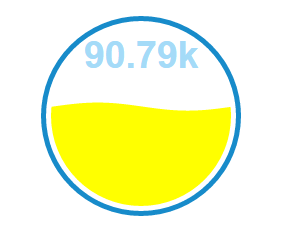
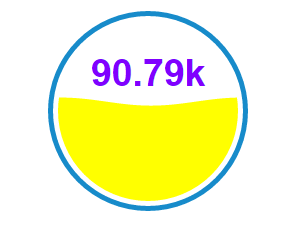
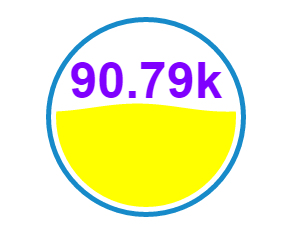
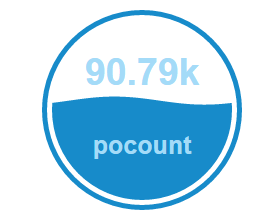
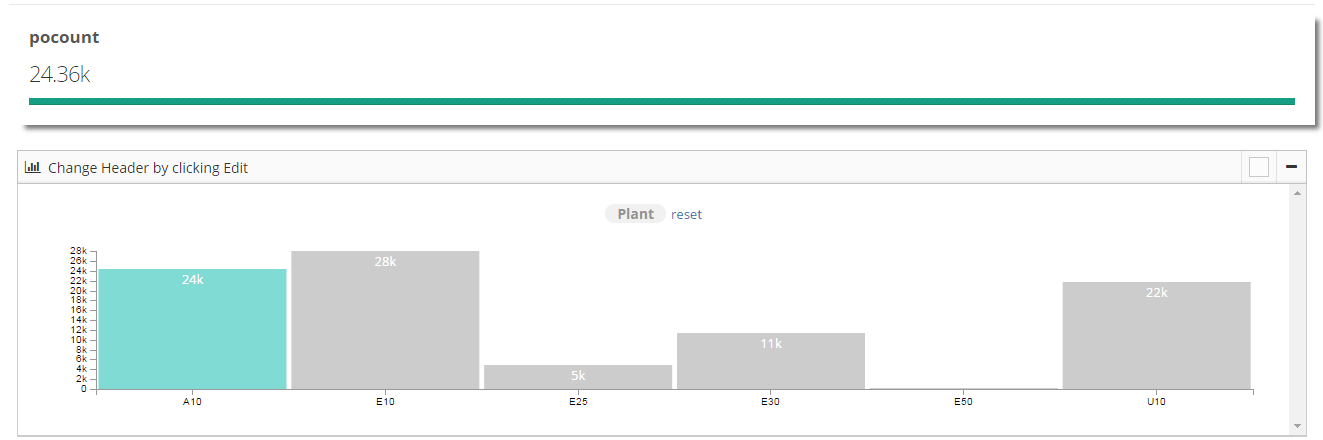
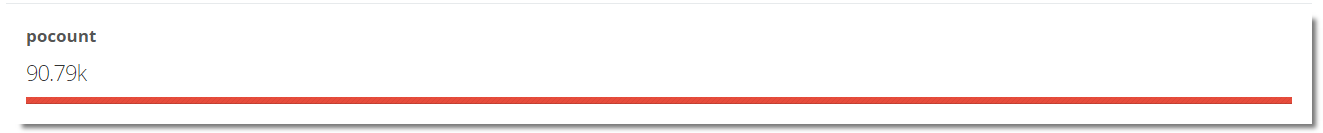
Summary Fillgauge
Edit properties:
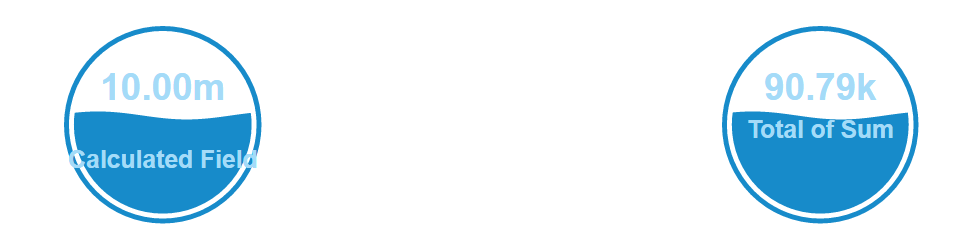
- Calculated Formula: Apllied only when aggregate is Calculated field ex:value1/(Value1-Value2) like
([pocount]/([pocount]+[netpr]))*100
Width: We can set width of the chart
Height: We can set height of the chart
Measure: In Measure we have all the fields available in the table and we can select any one from the drop down for which we want the summary.
Aggregate: We hve aggregate function like Sum, Count, AVG, Calculated Field, MIN, MAX, MEDIAN, DISTINCT and RATIO to get measure.
Dimension description: Select field to display name of dimension in tooltip
Number Format: Number Format is, in which format we want to display the number like .0F/,f
,f
Date Format: Format of date in data Ex: %m/%d/%Y (07/23/2016), %m/%d/%y (07/23/16), %Y-%m-%d (2016-07-23), %Y-%m (2016-07), Jan-16 (%b-%y)
Prefix: We can add some prefix like
$
Suffix: We can add some suffix like
%
- Field Name: Field Name is mandatory field, this is where we need to select any field for which we want the summary.
- Divider: Field value to get the percentage(number format should be %)
- Enable Click: If we will make Enable Click Yes then the chart will be clickable and the data will reflect according to click.
14. Filter By: We can specify any field by which we want to filter the data. A10
- Detail: Text on waves
- Desc Color: We can change the color of description
- Field Type: Specify field type (Number/Date/String)
- Min Value: We can set any minimum value
- Max Value: We can set any maximum value
- Desc Size
- Circle Fill Gap: We can increase and decrease the circle gap like 0.2
- Circle Thick Ness: We can edit circle’s thickness
- Circle Color: We can change the circle color
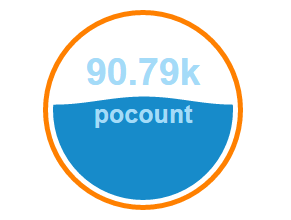
- Wave Risetime: We can increase and decrease the wave risetime
- Wave Count: We can set the number of waves
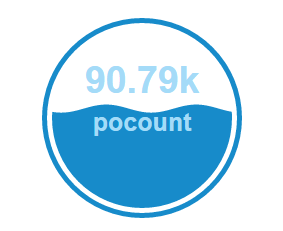
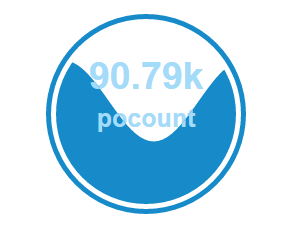
- Wave Height: We can increase and decrease the wave height
- Widget Color
- Wave Height Scaling
- Wave Rise
- Wave Animate Time: We can increase and decrease the wave animate time
- Wave Offset
- Wave Color: We can change the wave color
- Text Vert Position: We can set text’s vertical position
- Text Wave Color
- Text Color: We can change the text color
- Text Size
- Detail Vert Position: We can change detail text verical position
- Detail Color: We can change the color of detail text
- Detail Size: We can change the size of the detail text
- Wave Animate
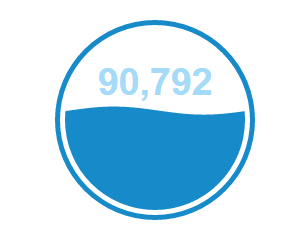
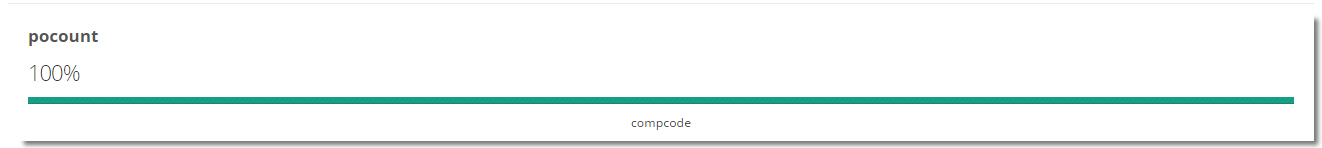
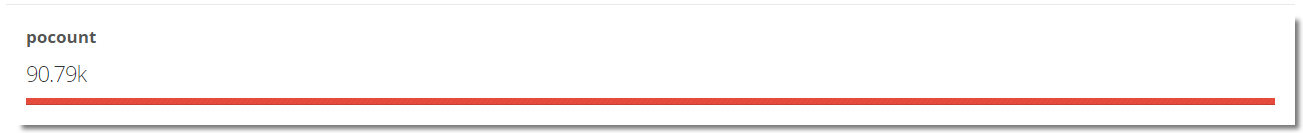
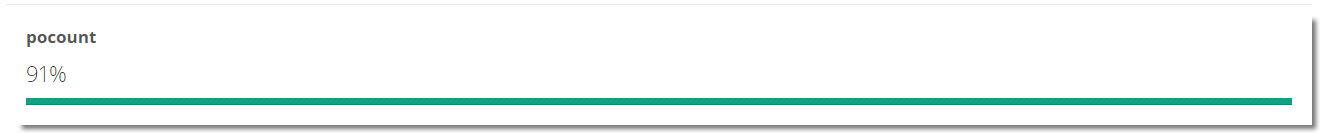
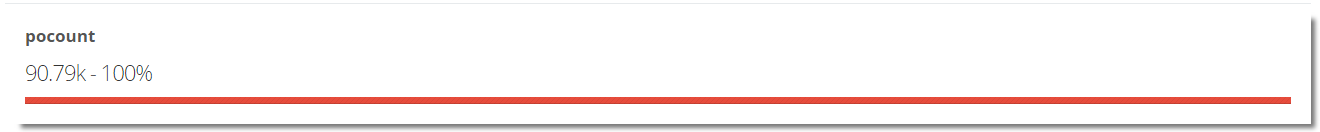
- Value Type: We have 3 types of value type percentage, value percentage and value
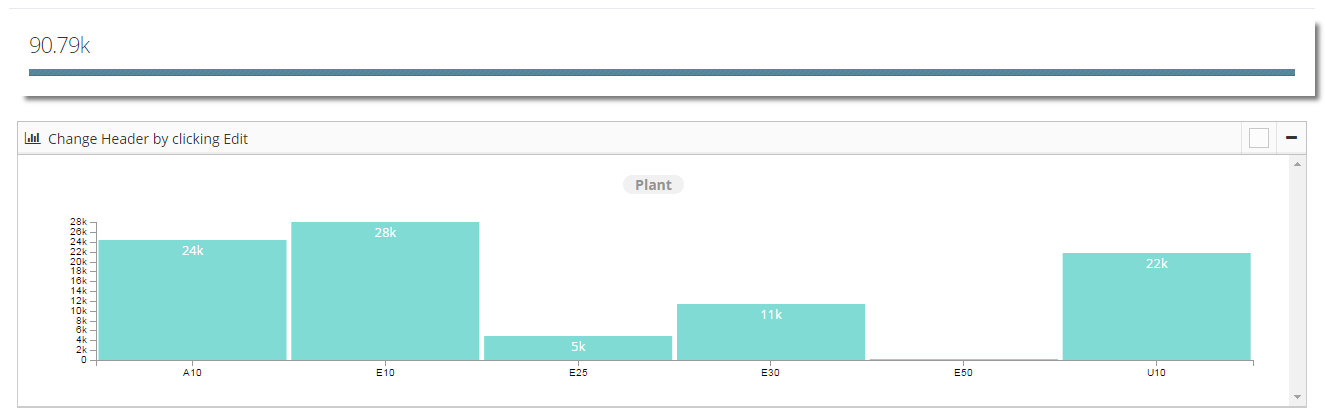
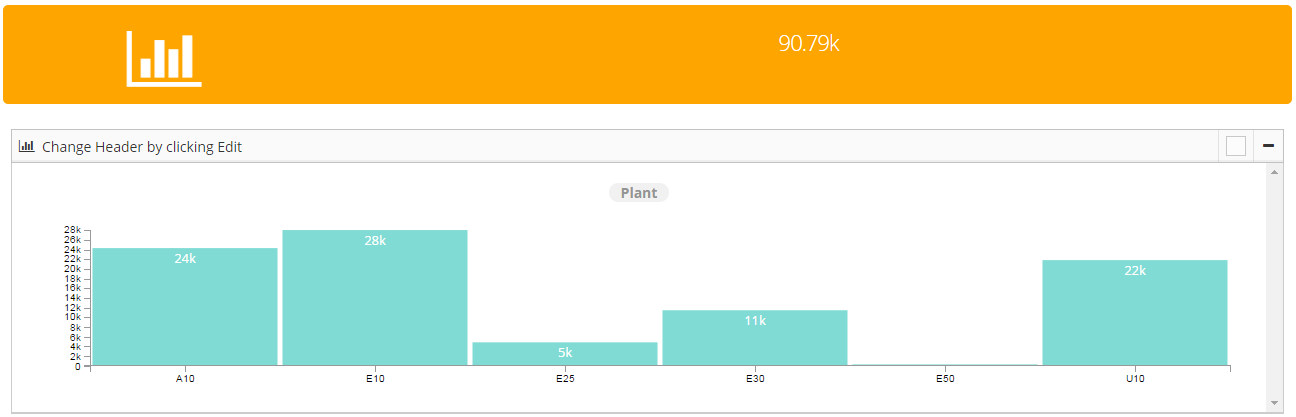
Summary Ibox
Edit properties:
- Calculated Formula: Apllied only when aggregate is Calculated field ex:value1/(Value1-Value2)
- Width: We can set the width of the chart
- Height: We can set the height of the chart
- Measure: In Measure we have all the fields available in the table and we can select any one from the drop down for which we want the summary.
- Aggregate: We hve aggregate function like Sum, Count, AVG, Calculated Field, MIN, MAX, MEDIAN, DISTINCT and RATIO to get measure.
- Dimension description: Select field to display name of dimension in tooltip
- Number Format: Number Format is, in which format we want to display our number like ,f
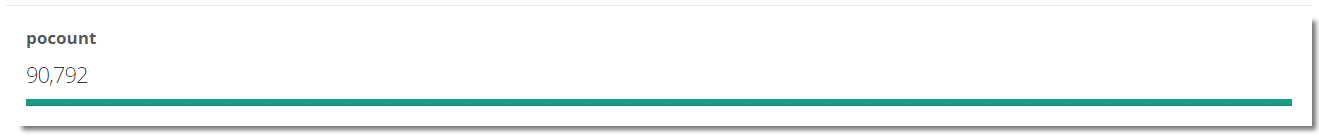
.0F
- Date Format: Format of date in data Ex: %m/%d/%Y (07/23/2016), %m/%d/%y (07/23/16), %Y-%m-%d (2016-07-23), %Y-%m (2016-07), Jan-16 (%b-%y)
- Prefix: To add some prefix like ‘$’
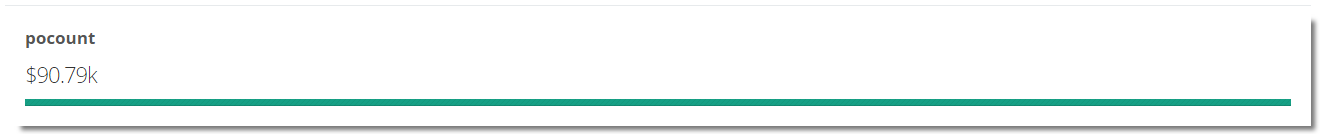
- Suffix: To add some suffix like ‘%’
- Filter:N From We have two options Top and Bottom. If we will select Top it will show 20 from the top of table and if we will select Bottom it will show 20 from the Bottom of table
- Filter-N: Default N- value: Here we have to pass some numeric value, It will return the number of rows whatever number we have passed.
- Field Name: It is a mandatory field, this is where we need to select any field for which we want the summary
- Divider
- Count
- Enable Click: If we will make Enable click yes then we are able to click and able to see some specific data
- Filter By: We can specify any field by which we want to filter the data.
- Detail: Detail is the text on chart, which describe the chart summary
- Field Type: We can have 3 types of fields String, Number and Date
- Min Value: We can set any minimum value
- Max Value: We can set any maximum value
- Process Bar Color: We can give any color to process bar
- Value Type: We have 3 types of value type percentage, value percentage and value
- percentage Type:
- value percentage Type:
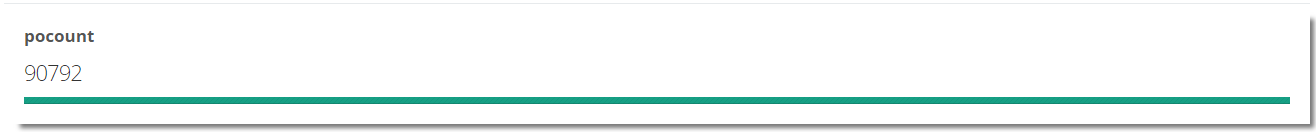
- value Type:
Summary Message
Edit properties:
- Calculated Formula: Apllied only when aggregate is Calculated field ex:value1/(Value1-Value2)
- Width: Width of the chart
- Height: Height of the chart
- Measure: In Measure we have all the fields available in the table and we can select any one from the drop down for which we want the summary.
- Aggregate: We hve aggregate function like Sum, Count, AVG, Calculated Field, MIN, MAX, MEDIAN, DISTINCT and RATIO to get measure.
- Dimension description: Select field to display name of dimension in tooltip

- Number Format: Number Format is, in which format we want to display our number like
.0F

,f

- Date Format: Format of date in data Ex: %m/%d/%Y (07/23/2016), %m/%d/%y (07/23/16), %Y-%m-%d (2016-07-23), %Y-%m (2016-07), Jan-16 (%b-%y)
- Prefix: To add some prefix like ‘$’

- Suffix: To add some suffix like ‘%’

- Filter:N From We have two options Top and Bottom. If we will select Top it will show 20 from the top of table and if we will select Bottom it will show 20 from the Bottom of table
- Filter-N: Default N- value: Here we have to pass some numeric value, It will return the number of rows whatever number we have passed.
- Field Name: It is a mandatory field, this is where we need to select any field for which we want the summary
- Divider
- Count
- Filter By: We can specify any field by which we want to filter the data.
- Enable Click: If we will make Enable click yes then we are able to click and able to see some specific data
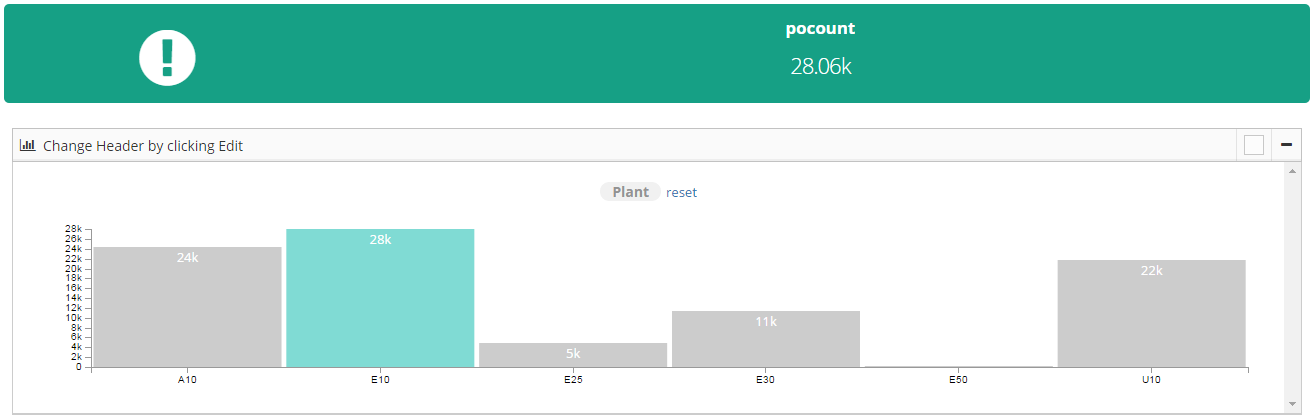
- Detail: Detail is the text on chart, which describe the chart summary
- Field Type: Specify field type (Number/Date/String)
- Widget Color: We can give any color to widget

- Widget Icon: We can add any icon to the summary
- Value Type: We have 3 types of value type percentage, value percentage and value
- percentage:

- value percentage:

- value:

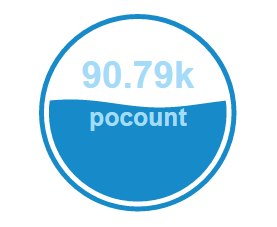
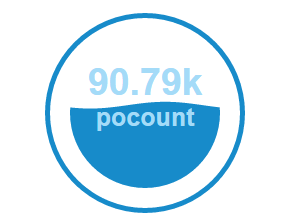
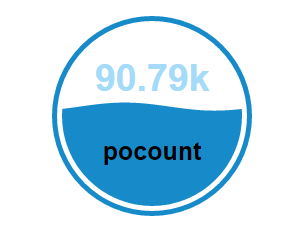
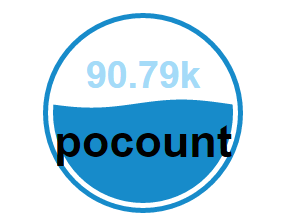
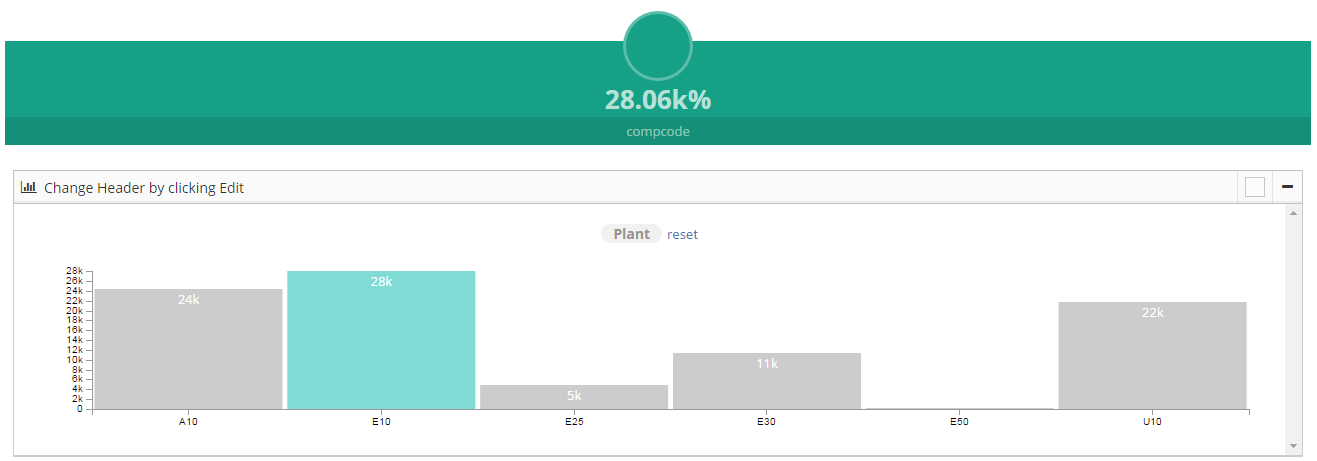
Summary Circle

Edit properties:
- Calculated Formula: Apllied only when aggregate is Calculated field ex:value1/(Value1-Value2)
- Width: We can set the width of the chart
- Height: We can set the height of the chart
- Measure: In Measure we have all the fields available in the table and we can select any one from the drop down for which we want the summary.
- Aggregate: We hve aggregate function like Sum, Count, AVG, Calculated Field, MIN, MAX, MEDIAN, DISTINCT and RATIO to get measure.
- Dimension description: Select field to display name of dimension in tooltip
- Number Format: Number Format is, in which format we want to display our number like ,f

.0F

- Date Format: Format of date in data Ex: %m/%d/%Y (07/23/2016), %m/%d/%y (07/23/16), %Y-%m-%d (2016-07-23), %Y-%m (2016-07), Jan-16 (%b-%y)
- Prefix: To add some prefix like ‘$’

- Suffix: To add some suffix like ‘%’
- Filter:N From, We have two options Top and Bottom. If we will select Top it will show 20 from the top of table and if we will select Bottom it will show 20 from the Bottom of table
- Filter-N: Default N- value: Here we have to pass some numeric value, It will return the number of rows whatever number we have passed.
- Field Name: It is a mandatory field, this is where we need to select any field for which we want the summary
- Divider
- Count
- Enable Click: If we will make Enable click yes then we are able to click and able to see some specific data
- Filter By: We can specify any field by which we want to filter the data.
- Detail: Detail is detail about the summary. Text on the summary

- Field Type: Specify field type (Number/Date/String)
- Font Size: We can change the font size of the text like we have selected ‘Extra Large’ font size-

- Widget Color: We can change the widget color

- Widget Icon: We can change the widget icon

- Value Type: We have 3 types of value type percentage, value percentage and value
- percentage:

- value percentage:

- value: